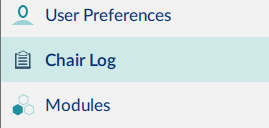
The LiNX system records statistics for battery use and driving. To view the wheelchair’s statistics, select Chair Log from the primary navigation sidebar.
The statistics display on the right-hand side of the main content area, showing battery and drive statistics. Battery usage displays at the top of the panel. Drive statistics display below the battery statistics.
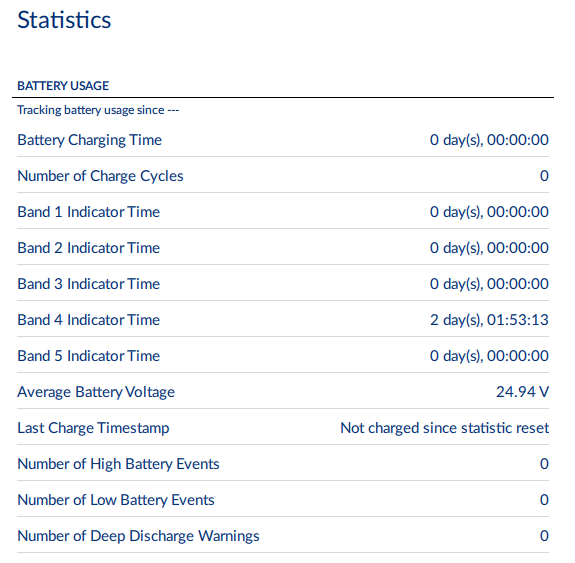
Battery statistics are detailed in the following table.
| Battery usage statistics | Details |
|---|---|
| Battery Charging Time | The length of time the batteries have been charged for |
| Number of Charge Cycles | The number of times the batteries have been charged |
| Band 1 Indicator Time | The total time the LiNX system is operated with the state of charge between 0 and 20% |
| Band 2 Indicator Time | The total time the LiNX system is operated with the state of charge between 20% and 40% |
| Band 3 Indicator Time | The total time the LiNX system is operated with the state of charge between 40% and 60% |
| Band 4 Indicator Time | The total time the LiNX system is operated with the state of charge between 60% and 80% |
| Band 5 Indicator Time | The total time the LiNX system is operated with the state of charge between 80% and 100% |
| Average Battery Voltage | The average battery voltage over the last 31 days |
| Last Charge Timestamp | The date and time the batteries were last put on charge |
| Number of High Battery Events | The number of high battery warnings |
| Number of Low Battery Events | The number of low battery warnings |
| Number of Deep Discharge Warnings | The number of deep discharge warnings |
To view more information about a battery statistic: click on a statistic, and a description displays. To reset the battery statistics’ values, click Reset when in the connection context, at the top of the battery statistics.
Resetting the battery statistics resets the enhanced battery gauge algorithm. If your system uses the enhanced battery gauge: after resetting the battery statistics, we recommend placing the wheelchair’s batteries on charge for a complete charging cycle so the enhanced battery gauge can display an accurate state of charge.
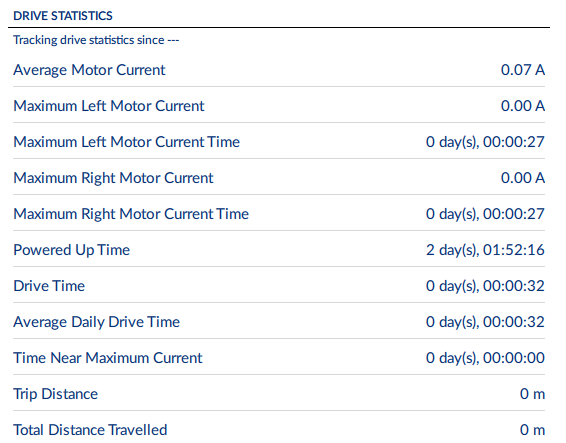
Drive statistics are shown below the battery statistics. Use the scroll bar to access them.
| Drive statistic | Details |
|---|---|
| Average Motor Current | The average current drawn across all motors while driving |
| Maximum Left Motor Current | The peak measured motor current |
| Maximum Left Motor Current Time | Time spent drawing the “Maximum Drive Current Draw” |
| Maximum Right Motor Current | The peak measured motor current |
| Maximum Right Motor Current Time | Time spent drawing the “Maximum Drive Current Draw” |
| Powered Up Time | The total time the wheelchair controller is powered up |
| Drive Time | The total time the wheelchair has been driven |
| Average Daily Drive time | Average drive time over a 24 hour period, and averaged over previous 24 hour periods |
| Time Near Maximum Current | The duration the current was within 20% of maximum threshold |
| Trip Distance | The total distance travelled by this wheelchair in meters since being reset by the user. |
| Total Distance Travelled | The total distance travelled by this wheelchair since being reset by a service agent. |
To view more information about a drive statistic: click a statistic, and a description displays. To reset the drive statistics’ values, click Reset when in the connection context, at the top of the drive statistics.