Diagnostic screens let you view information about system activity. From these screens you can view:
- live diagnostics
- the system summary
- the chair log – active and previous errors
- chair statistics
Live diagnostics overview
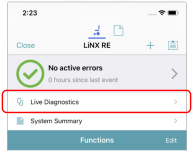
Diagnostic screens are accessed by tapping on the Live Diagnostics button on the Home screen.
There are five types of live diagnostic screens available when the LiNX Access iOS tool is connected to a wheelchair — they are:
| Live diagnostics — DriveLive diagnostics — Angle SensorLive diagnostics — Angle SourcesLive diagnostics — Actuator ChannelsLive diagnostics — Control Inputs | 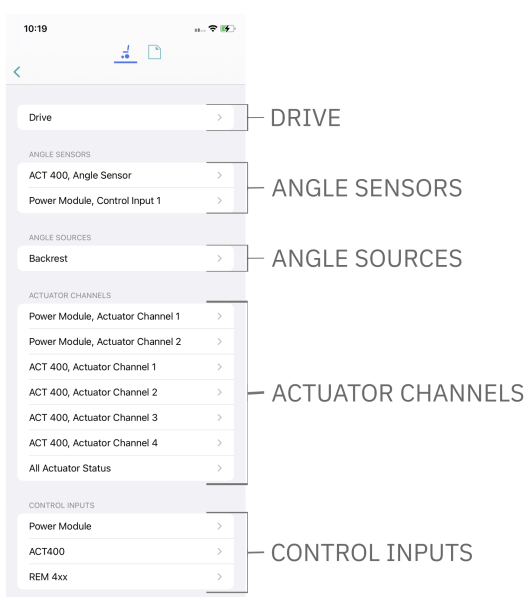 |
| NOTE | 1. The type of diagnostic screen available depends on your configuration. For example, if there are no angle sources in your configuration, then Angle Sources will not be displayed. 2. The Live Diagnostic screens, Actuator Channels, and Control Inputs can only be viewed with devices running iOS 16.0 or higher. |
Live diagnostics — Drive
When connected to a wheelchair, tap Live Diagnostics | Drive to view real-time graphs and data:
| Speed Demand (%)Turn Demand (%)Left MotorVoltage (V)Current (A)Resistance (mΩ)Right MotorVoltage (V)Current (A)Resistance (mΩ)Battery Voltage (V)Speed Dial (%)Note: Tap Back to exit the diagnostics | 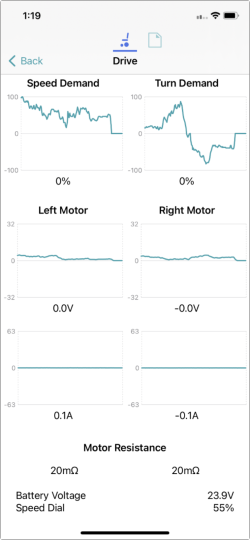 |
Live diagnostics — Angle Sensor
| When connected to a wheelchair, and if one or more angle sensors are configured and enabled, tap Live Diagnostics and then select an angle sensor to view a real-time graph of the selected angle sensor’s angle. | 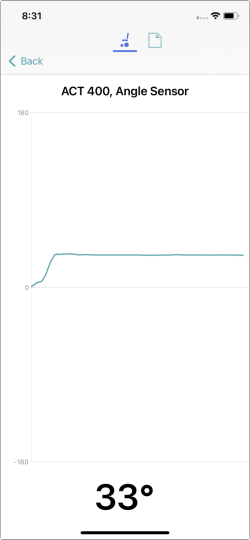 |
Live diagnostics — Angle Sources
| Tap Live Diagnostics and then select an angle source to view a real-time graph and numerical display of the selected angle source’s angle. Note: only available if one or more angle sources are configured. Tap Back to exit Angle Sources diagnostics. | 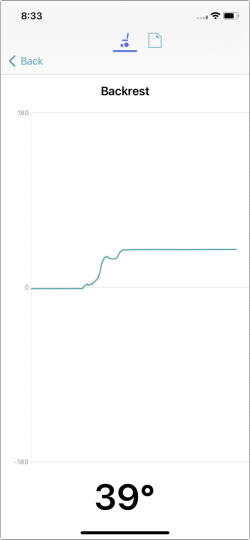 |
Live diagnostics — Actuator Channels
| Tap Live Diagnostics and then select an actuator channel to view its:real-time current graphreal-time direction and current (amps)minimum and maximum current (amps). Tap Back to exit Actuator Channels diagnostics. NOTEThis screen can only be viewed on a device running iOS 16.0 or higher. | 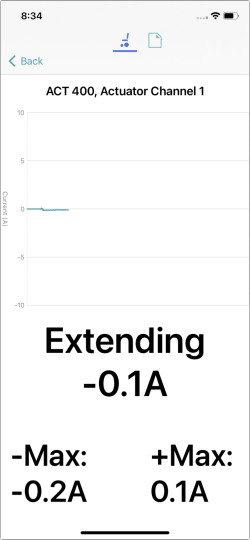 |
Live diagnostics — Control Inputs
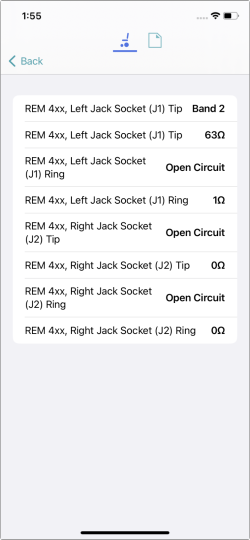 | Tap Live Diagnostics and then select a control input to view its:status messagemeasured resistance value (ohms) Tap Back to exit Control Inputs diagnostics. Note that each control input is displayed across two rows in the table (see image below): the first is its status message, the second is its measured resistance value. 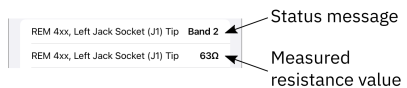 NOTEThis screen can only be viewed on a device running iOS 16.0 or higher. NOTEThis screen can only be viewed on a device running iOS 16.0 or higher. |
If any measured resistance does not correspond to a switched resistance band (see table, below), that is, band 0–16 has not been detected, the status message row will display one of the following:
- Invalid — monitored: invalid band
- Failsafe Open Circuit — monitored: open circuit
- Open Circuit — monitored: invalid band
- Unstable — input is not stable
- Error/Unknown — displayed when an error occurs, or the input port is not configured for a control input
For any of the above status messages, the resistance displayed in the measured resistance value row will have no meaning and can be ignored.
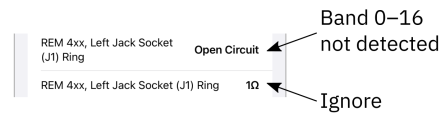
If the measured resistance corresponds to one of the resistance bands (band 0–16 listed in the table below), the status row displays the detected resistance band (Band 1, Band 2 etc), and the resistance value row displays the actual resistance at the input, corresponding to the band displayed in the first row.
Resistor band ranges
| Band | Lower limit(including) | Nominal | Upper limit (excluding) |
|---|---|---|---|
| Band 0 (monitored: short circuit) | 0 | – | 17 |
| Band 1 | 17 | 34 | 51 |
| Band 2 | 51 | 68 | 85 |
| Band 3 | 85 | 102 | 119 |
| Band 4 | 119 | 136 | 153 |
| Band 5 | 153 | 170 | 187 |
| Band 6 | 187 | 204 | 221 |
| Band 7 | 221 | 238 | 255 |
| Band 8 | 255 | 272 | 289 |
| Band 9 | 289 | 306 | 323 |
| Band 10 | 323 | 340 | 357 |
| Band 11 | 357 | 374 | 391 |
| Band 12 | 391 | 408 | 425 |
| Band 13 | 425 | 442 | 459 |
| Band 14 | 459 | 476 | 493 |
| Band 15 | 493 | 510 | 527 |
| Band 16 | 527 | 544 | 578 |
The system summary
| Tap System Summary to view the System Summary screen.The System Summary screen displays details of the system’s connected modules and tools, such as:a connected module’s identifiera module’s software versiona module’s serial numberthe access level of the LiNX Access KeyA link to the Dynamic Controls website is at the bottom of the screen. | 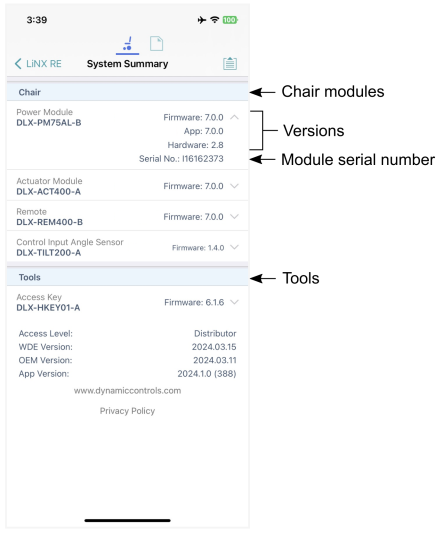 |
System status
| The system status displays what errors (if any) are currently active.Tapping on the system status gives you access to:chair logchair statistics | 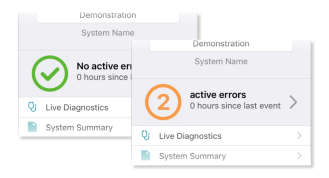 |
The chair log
| Tap Active Errors, then tap Chair Log to display:a list of active errorsa list of previous errors in the event logEach entry in the log displays the error, its flash code (e.g. FC 3:7), and the component where the error occurred.Tap an error entry to view further information on the error.You can clear the event log by scrolling to the bottom of the list and tapping Clear Event Log. | 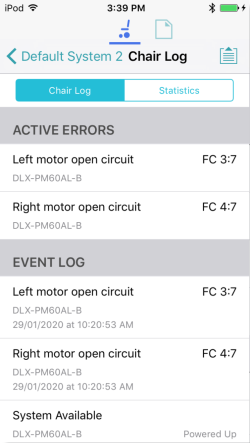 |
Chair statistics
Tap Statistics to view current system statistics.

The statistics screen is divided into the following sections:
- Battery usage
- Drive statistics
Battery usage
The battery usage statistics are in the top section of the statistics screen.
- To view more information about a battery usage statistic, tap the statistic, and a description displays under it.
- To reset the statistics, click Reset Battery Usage at the bottom of the battery usage section.
Available battery usage statistics are detailed in the table below:
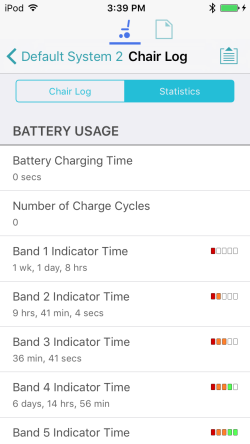
| Battery usage statistics | Details |
|---|---|
| Battery Charging Time | The time that the batteries have been charged for |
| Number of Charge Cycles | The number of times the batteries have been charged |
| Band 1 Indicator Time | The total time the LiNX system is operated with the state of charge between 0 and 20% |
| Band 2 Indicator Time | The total time the LiNX system is operated with the state of charge between 20% and 40% |
| Band 3 Indicator Time | The total time the LiNX system is operated with the state of charge between 40% and 60% |
| Band 4 Indicator Time | The total time the LiNX system is operated with the state of charge between 60% and 80% |
| Band 5 Indicator Time | The total time the LiNX system is operated with the state of charge between 80% and 100% |
| Average Battery Voltage | The average battery voltage over the last 31 days |
| Last Charge Timestamp | The date and time when the batteries were last put on charge |
| Number of High Battery Events | The number of high battery warnings |
| Number of Low Battery Events | The number of low battery warnings |
| Number of Deep Discharge Warnings | The number of deep discharge warnings |
| Battery Usage Last Reset | Date when these statistics were last reset |
Drive statistics
The drive statistics are in the lower section of the statistics screen, below the battery statistics.
- To view more information about a drive statistic, tap a statistic, and a description displays below it.
- To reset the statistics, click Reset Drive Statistics at the bottom of the drive statistics section.
| Drive statistic | Details |
|---|---|
| Average Motor Current | The average current drawn across all motors while driving |
| Maximum Left Motor Current | The peak measured motor current |
| Maximum Left Motor Current Time | Time spent drawing the “Maximum Drive Current Draw” |
| Maximum Right Motor Current | The peak measured motor current |
| Maximum Right Motor Current Time | Time spent drawing the “Maximum Drive Current Draw” |
| Powered Up Time | The total time the wheelchair controller is powered up |
| Drive Time | The total time the wheelchair has been driven |
| Average Drive Time | Average drive time |
| Time Near Maximum Current | The duration the current was within 20% of maximum threshold |
| Trip Distance | The total distance travelled by this wheelchair in meters since being reset by the user. |
| Total Distance Travelled | The total distance travelled by this wheelchair since being reset by a service agent. |
| Drive Statistics Last Reset | Date when these statistics were last reset |